Description
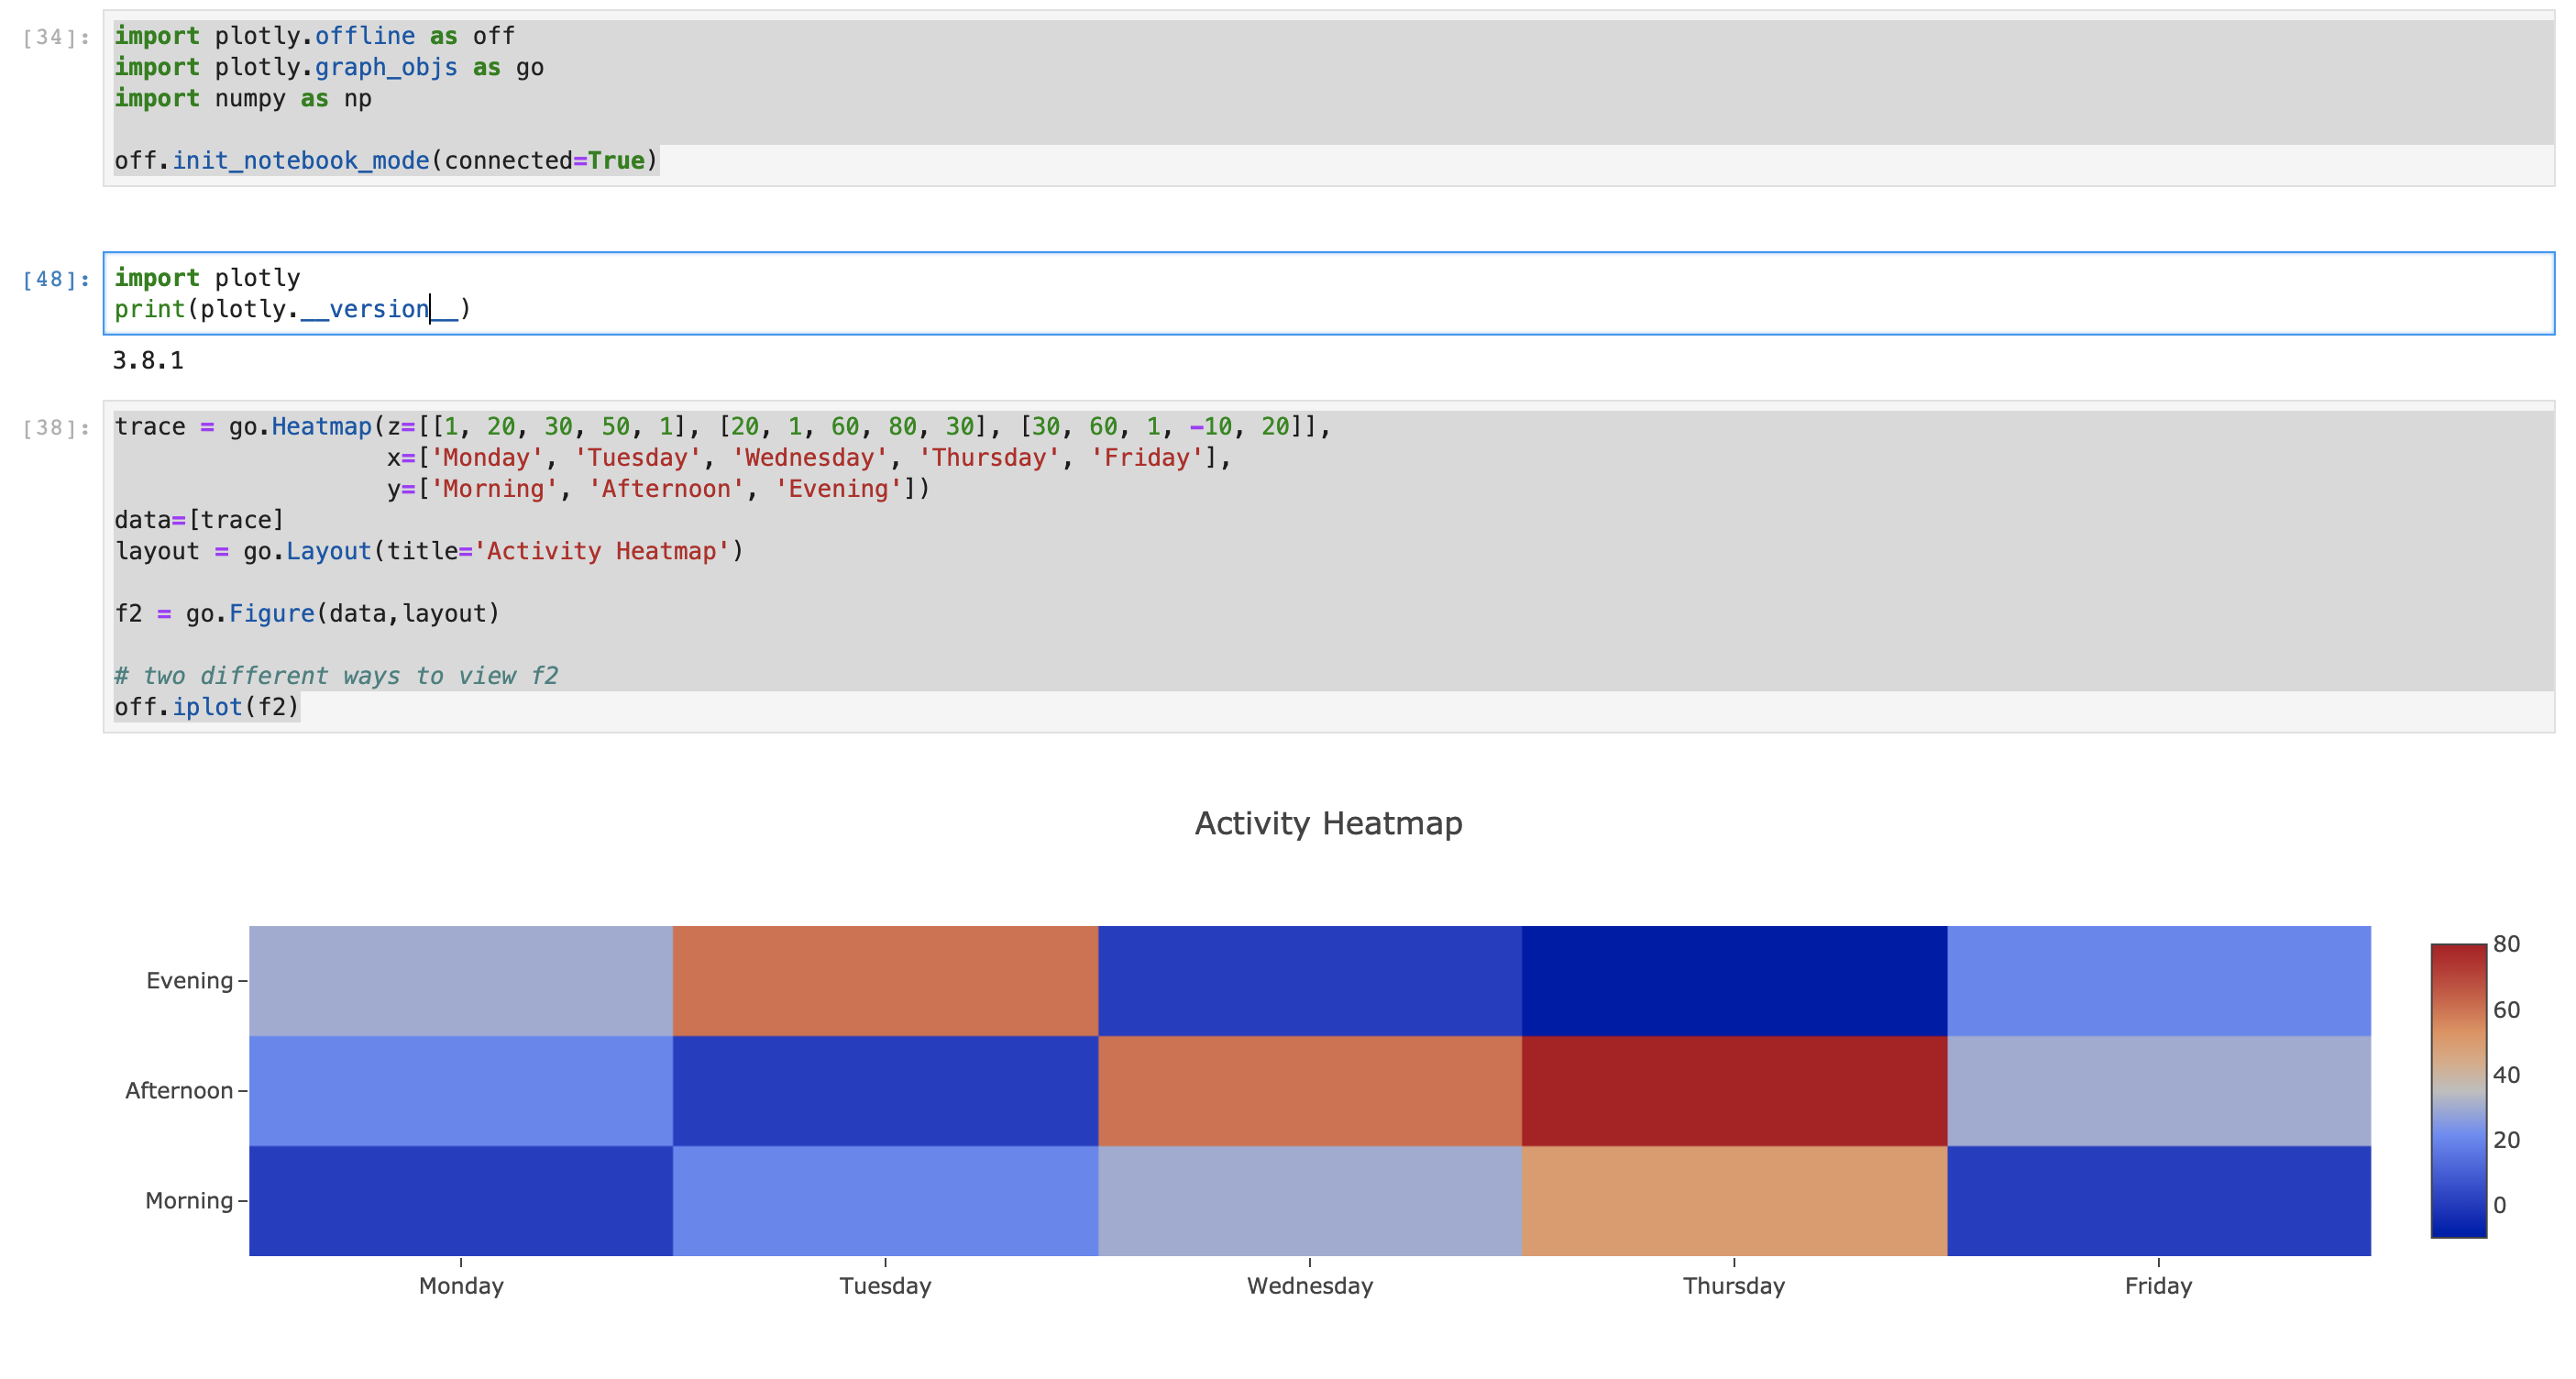
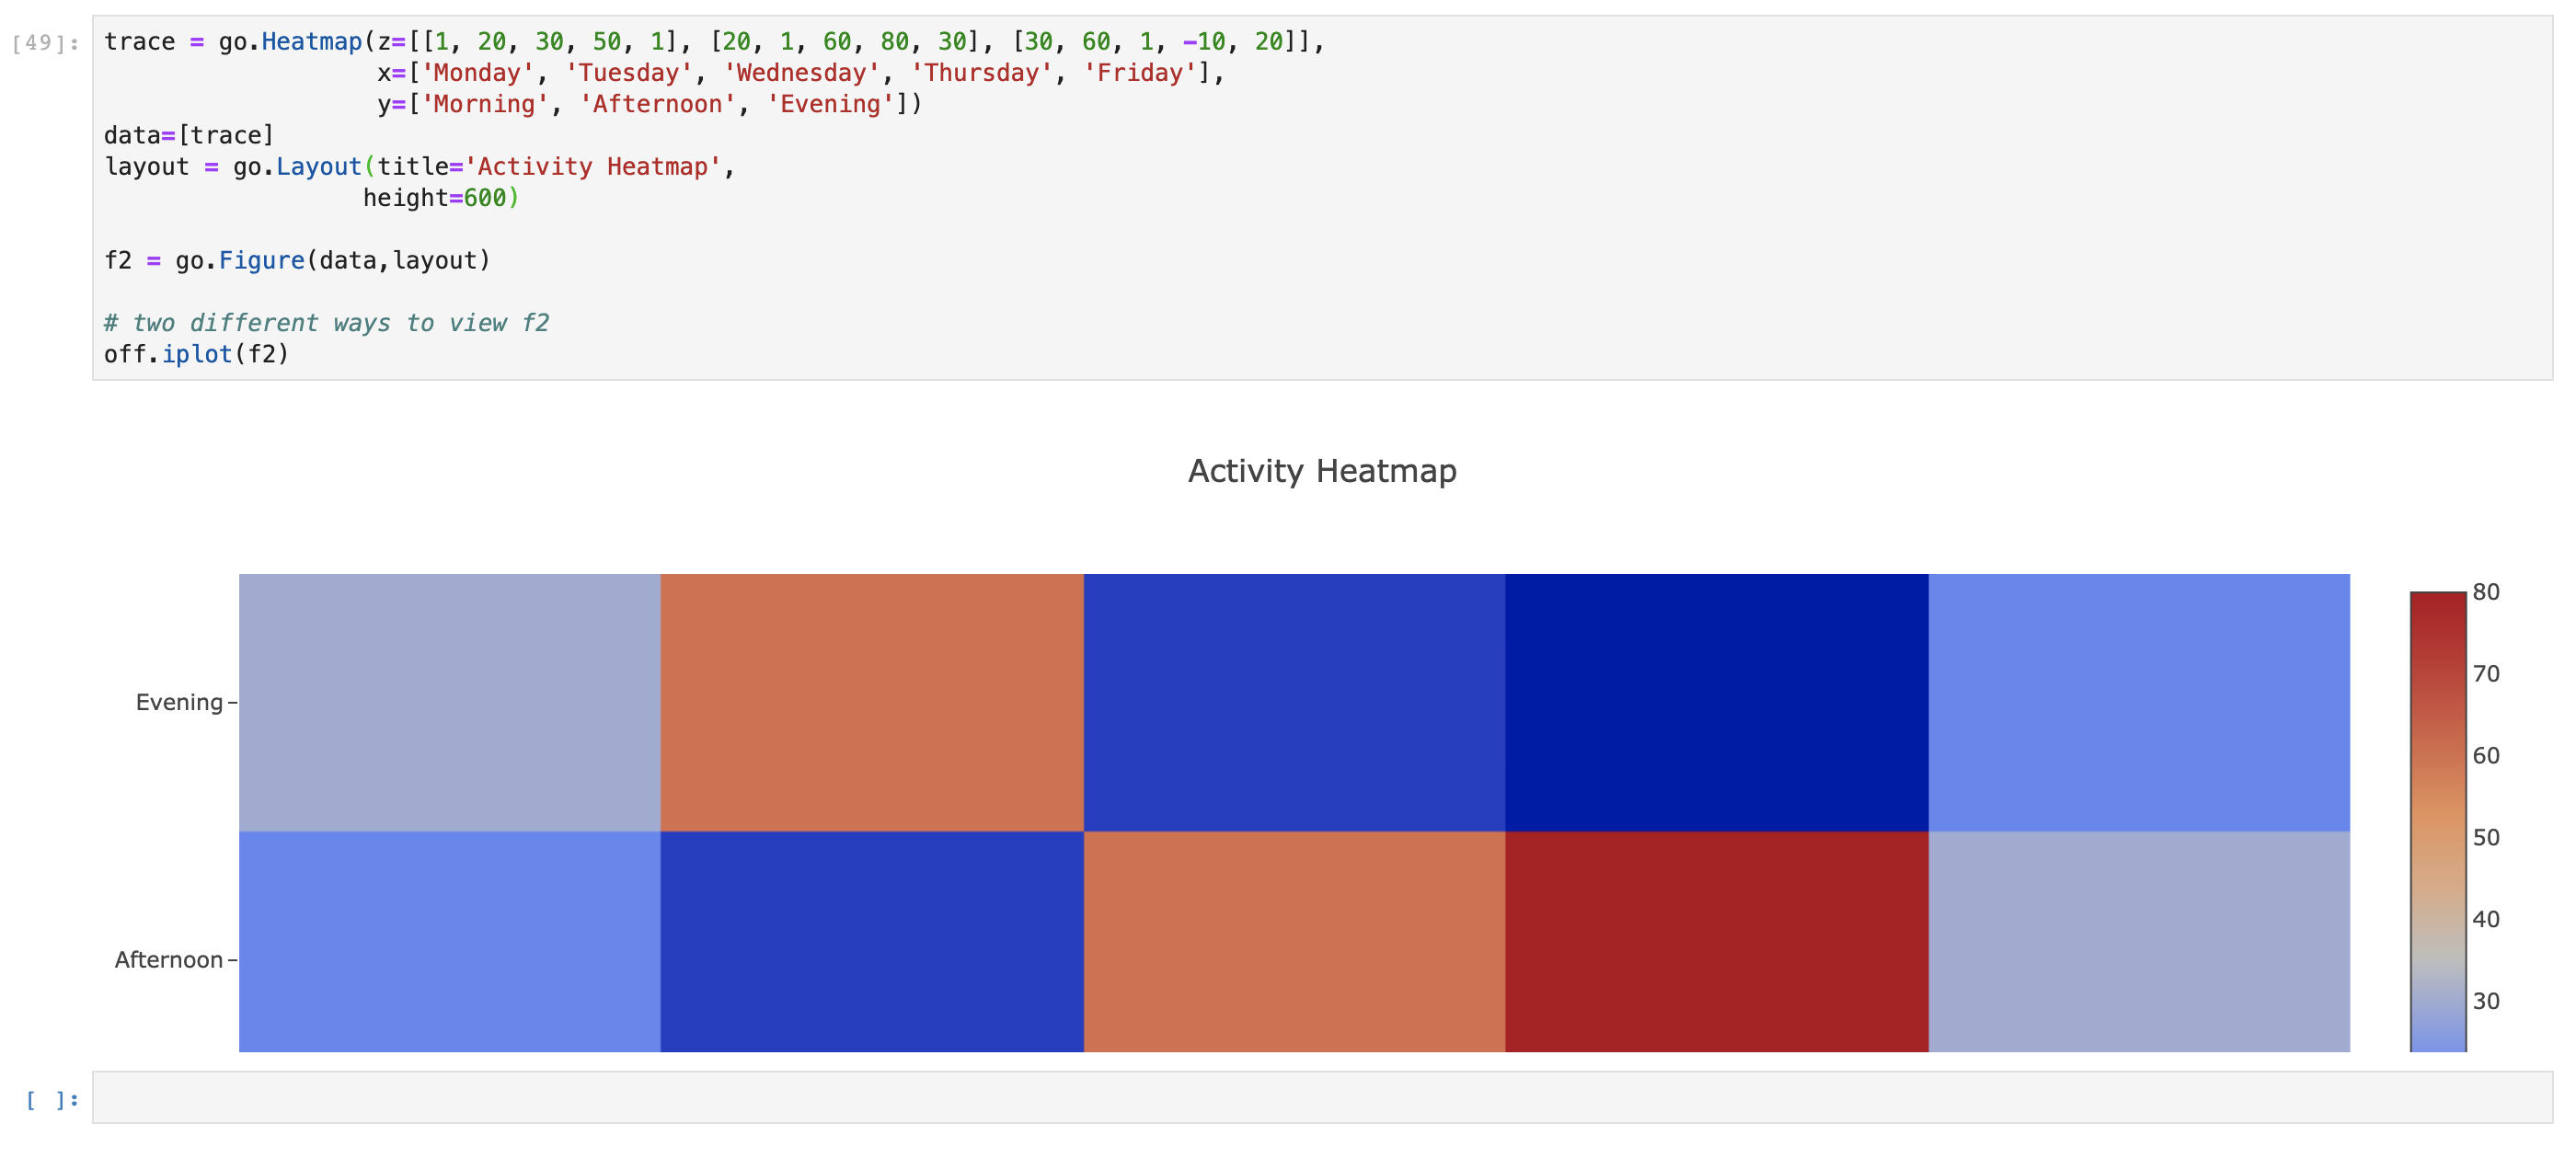
I'm trying to use plotly offline iplot in JupyterLab on AWS SageMaker. When I use offline iplot, the graph adjusts to the default cell output heigh of 360px instead of adjust the cell output size to the default graph height of 450px. When I try to set the height to a fixed height of 600px, the cell doesn't adjust and cuts off the bottom half of the graph.
I followed the instructions for installing all necessary widgets and extensions to work in JupyterLab. The following is my code.
`import plotly.offline as off
import plotly.graph_objs as go
import numpy as np
off.init_notebook_mode(connected=True)
trace = go.Heatmap(z=[[1, 20, 30, 50, 1], [20, 1, 60, 80, 30], [30, 60, 1, -10, 20]],
x=['Monday', 'Tuesday', 'Wednesday', 'Thursday', 'Friday'],
y=['Morning', 'Afternoon', 'Evening'])
data=[trace]
layout = go.Layout(title='Activity Heatmap')
f2 = go.Figure(data,layout)
two different ways to view f2
off.iplot(f2)
`
Here is a picture of my output
When I try to set the height manually to 600px in the layout, here is what I'm returned:
I've tried with both go.Figure and go.FigureWidget

