Closed
Description
Hi,
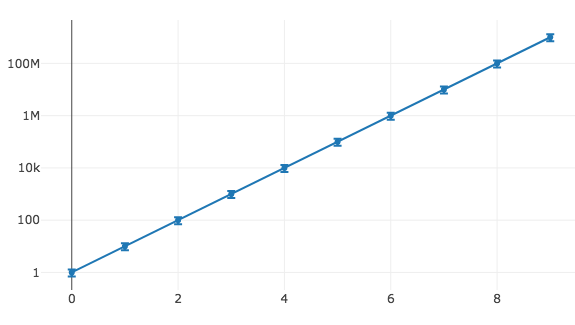
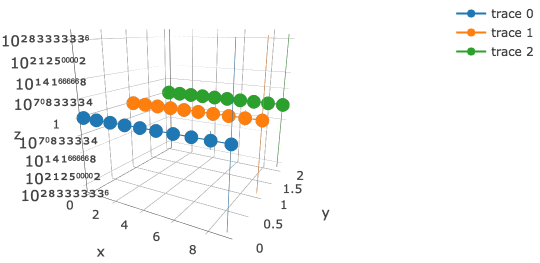
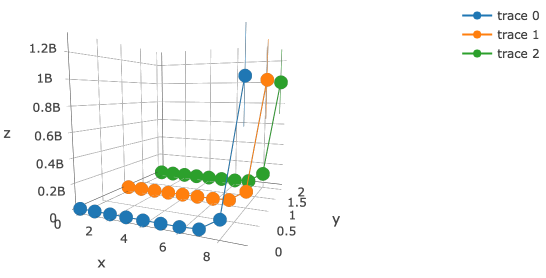
generating a Scatter plot with a logarithmic y axis and given error_y works fine whereas creating a similar plot with Scatter3d with error bars results in extremely large error bars. The proportions of the error bars in the 3D plot are correct if type='log' is omitted.
Example:
#!/usr/bin/env python3
# encoding=utf-8

import plotly.plotly as py
import plotly.graph_objs as go
import plotly.offline

import numpy as np

measurements = list(range(3))
x = np.array(range(10))
z = np.array([10**i for i in range(10)])
z_errors = z * 0.3

# 2D plot
trace = [go.Scatter(
	x = x,
	y = z,
	error_y = dict(
		type = 'data',
		array = z_errors,
		visible = True,
	),
)]

layout = go.Layout(
	yaxis = dict(
		type = 'log',
	),
)

fig = go.Figure(data=trace, layout=layout)
plotly.offline.plot(fig, filename='example_2d.html')

# 3D plot
traces = [go.Scatter3d(
	x = x,
	y = [constant] * len(x),
	z = z,
	error_z = dict(
		type = 'data',
		array = z_errors,
		visible = True,
	),
) for constant in measurements]

layout = go.Layout(
	scene = dict(
		zaxis = dict(
			type 	= 'log',
		),
	)
)

fig = go.Figure(data=traces, layout=layout)
plotly.offline.plot(fig, filename='example_3d.html')
Results:


